
9.3. Map Projections#
There are a number of problems when it comes to representing a sphere on a two-dimensional surface. As a result, there are any number of ways that you can project a sphere onto a two-dimensional surface; each projection has positive and negative elements. In order to choose which projection is best for your needs, you’ll have to make a compromise about something and the goal is to compromise on something that you are the least concerned about.
For example, plotting a meteorological map we are not concerning ourselves with being able to navigate using the map, so having true latitude and longitude lines is a luxury that we can afford to do without. Something more important for our purposes would be to represent the shape of landmasses as well as possible.
Plate Carrée#
This is a cylindrical projection that offers a simple way to view data that have geographic coordinates (e.g., latitude and longitude coordinates). The latitude and longitude lines intersect at right angles and produces rather large distortions of geographic area at the poles (similar but not quite as extreme as a Mercator projection). This is a reasonable default projection (Fig. 9.2) when you are first inspecting data, but better choices can be made depending on your data visualization and analysis needs.
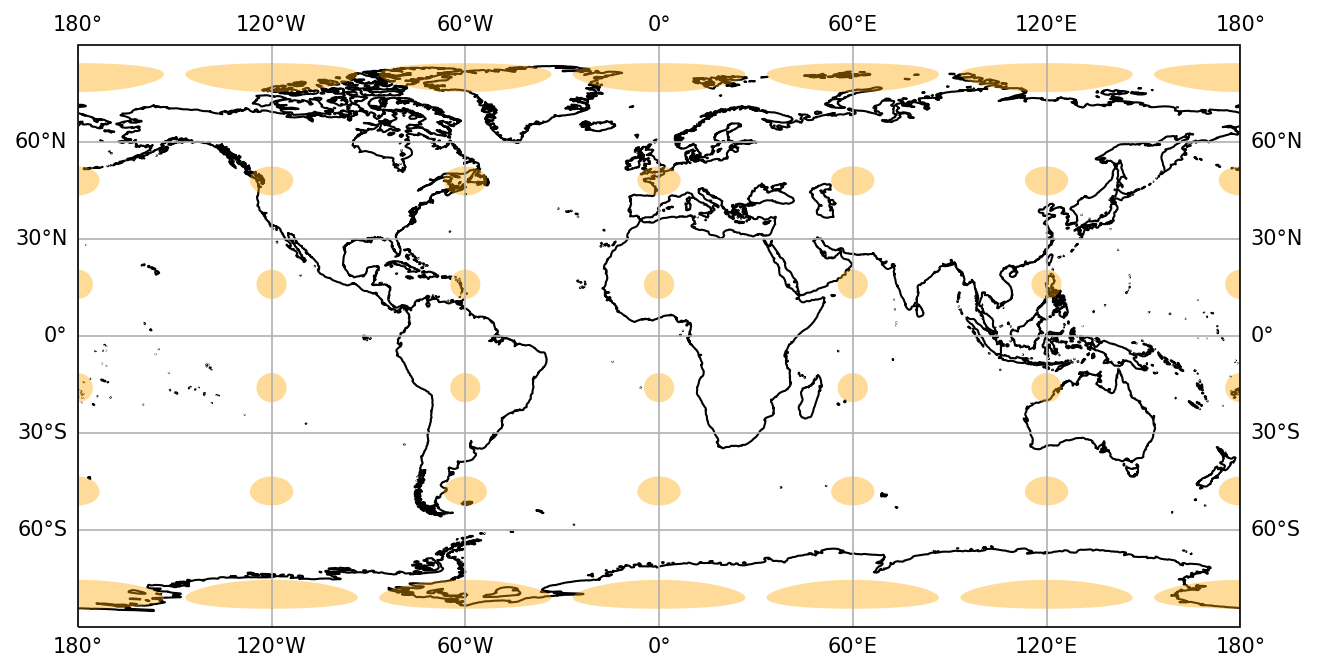
Fig. 9.2 Representation of the Plate Carrée projection using Cartopy with the Tissot indicatrix plotted in orange showing the map distortion due to the projection.#
Polar Stereographic#
Many early maps were focused on navigation and the countries in the mid-latitude regions of the Northern Hemisphere. As a result, certain areas of the globe were generally not well mapped. One of the more difficult areas to map is the Polar Regions of the two hemispheres. These areas are problematic as lines of longitude converge to a single point at the pole. These difficulties were overcome by projecting the features of the sphere onto a map with the center placed over the pole. A stereographic projection is an azimuthal projection coordinate and an example of the Northern Hemispheric stereographic projection is given below (Fig. 9.3). Such that the middle of the map is the north pole and as you move away from that point you move toward the equator. A similar map can be made looking at the south pole. This is a great map if you are looking to represent an entire hemisphere that has considerably less distortion of area. An example of its usage in meteorology would be for a hemispheric plot of 300-hPa heights to determine the wavenumber of the hemispheric pattern.
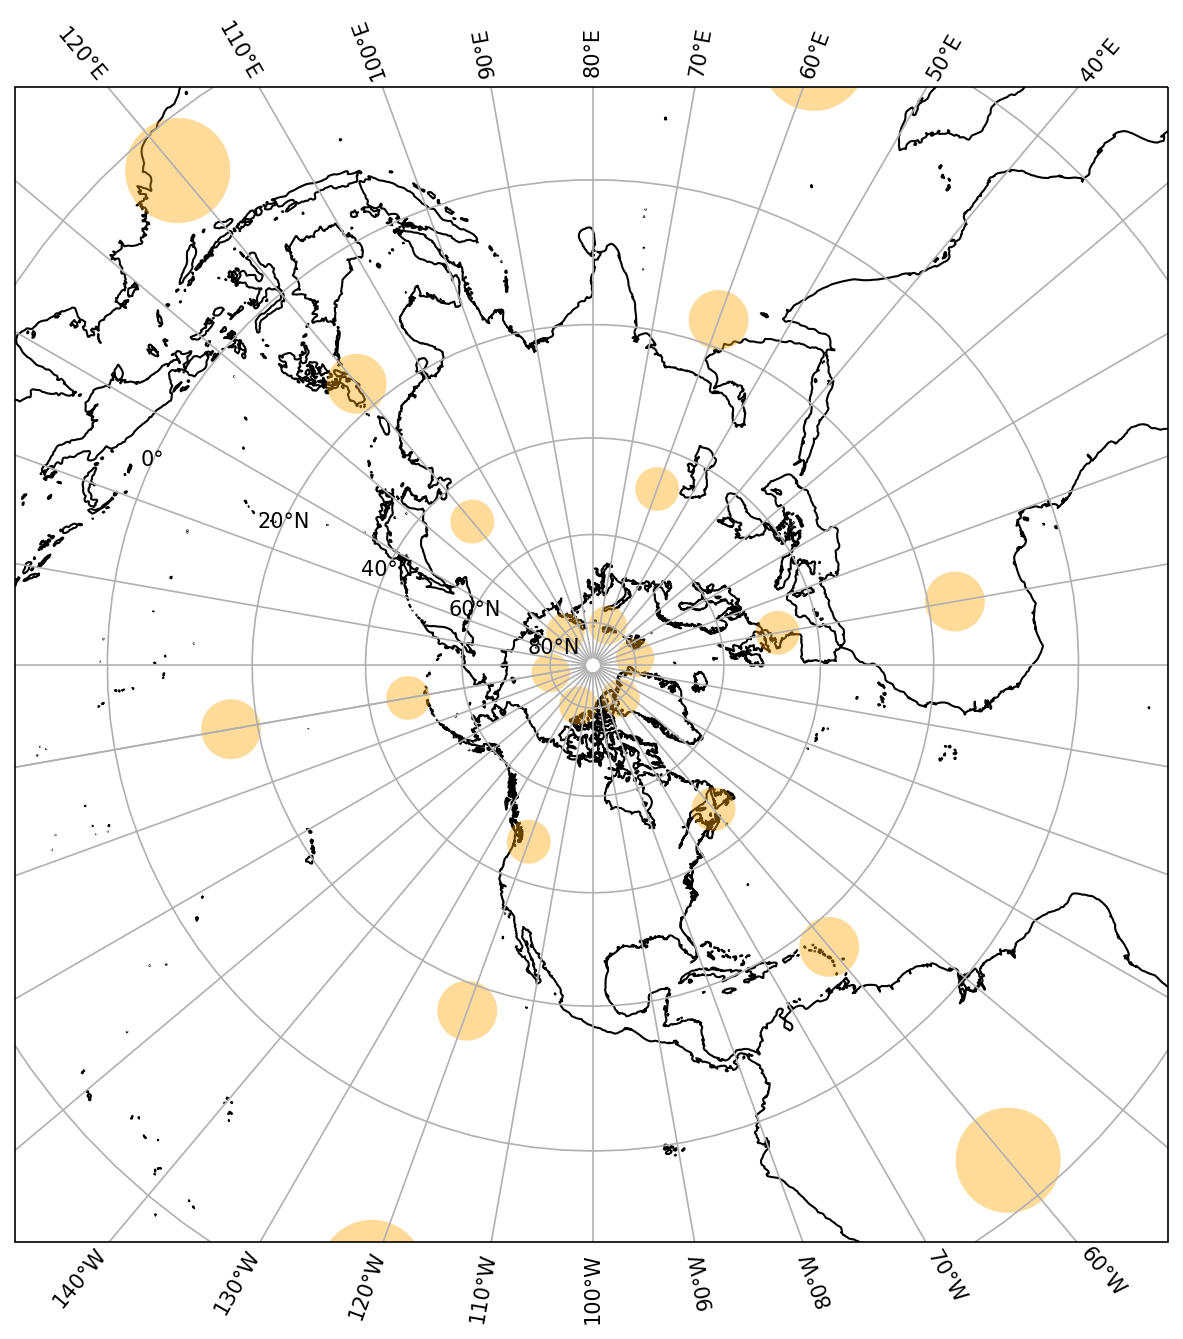
Fig. 9.3 Representation of the Polar Stereographic projection focused on the North Pole with a central longitude of -100°E using Cartopy with the Tissot indicatrix plotted in orange showing the map distortion due to the projection.#
For more information on the mathematics behind the polar stereographic projection, checkout the online article at Wolfram MathWorld.
Lambert Conformal#
So far we have briefly looked at the Plate Carree and Stereographic projections, which have their own strengths and weaknesses for meteorological purposes in the mid-latitude regions. A better projection for plotting data focused on mid-latitude regions is based on conic principles and has been widely used since the First World War (Fig. 9.4). The primary conic projection used is called the Lambert Conic Conformal (LCC) Projection. The conic conformal projection, when constructed, essentially forms a cone around the globe, which results in minimal distortion through much of the mapped area. This can only be used for regional perspectives (e.g., the CONUS) as specification of a central longitude and parallel latitudes will determine the minimal distorted area of the map.
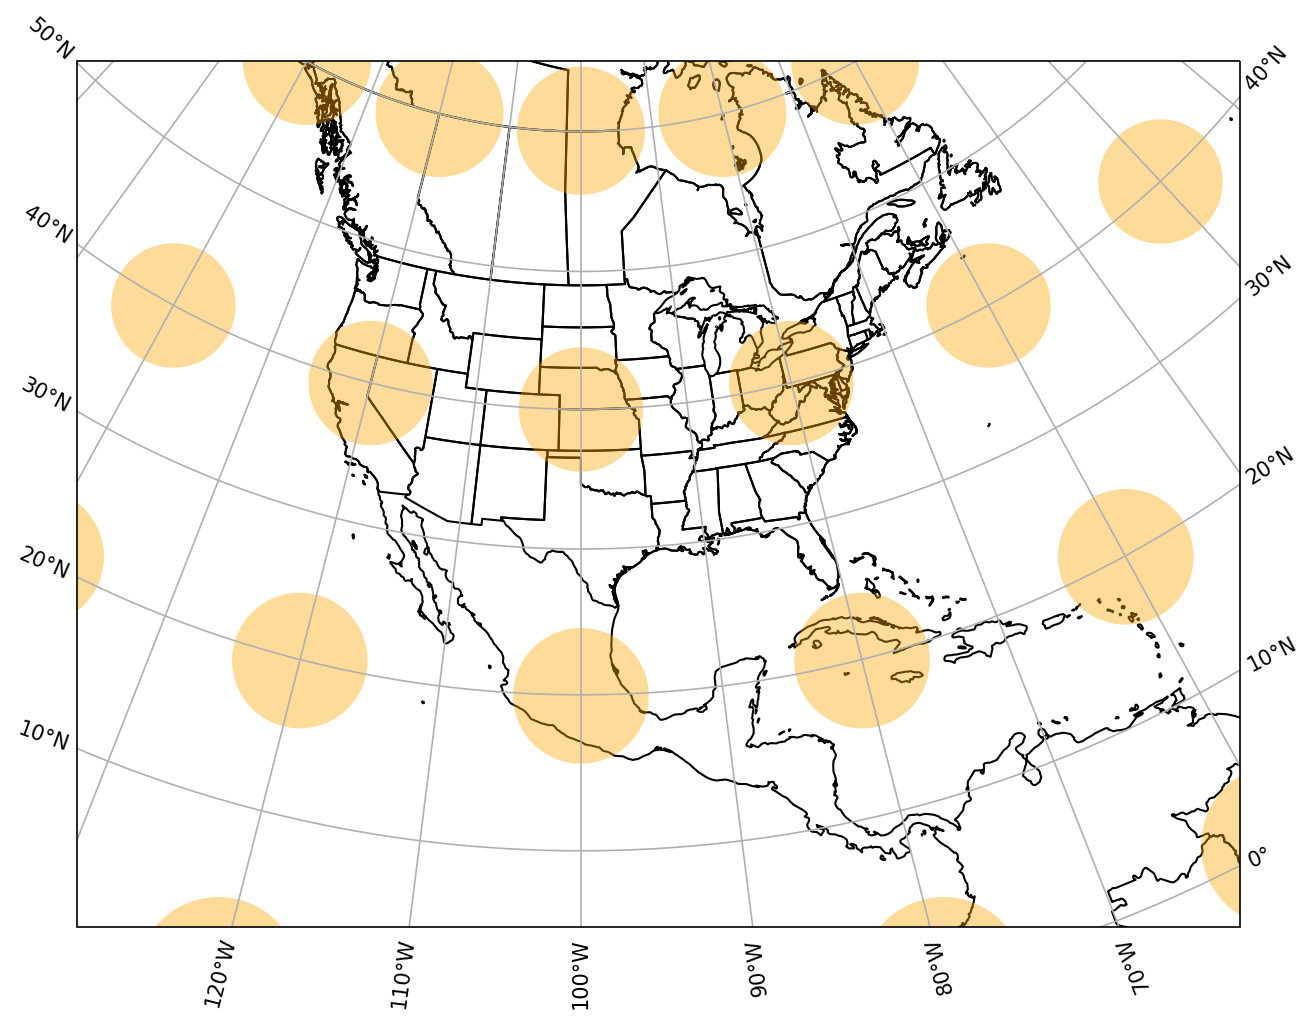
Fig. 9.4 Representation of the Lambert Conformal projection with a central longitude of -100°E and parallel latitudes of 30°N and 60°N using Cartopy with the Tissot indicatrix plotted in orange showing the map distortion due to the projection.#
There is a lot more information about map projections and their positive and negative features. There are a number of websites that have good information about various map projections and I found that this ESRI site was particularly good. For a full list of the projections available within the Cartopy package, visit this site.