18.4. Practice Tasks - Derived Parameters#
Select one (or more) of the following websites (or choose your own) and navigate through to explore maps on vorticity (typically shown at 500 hPa) and temperature advection (at 850 hPa). Explore patterns relative to features such as upper-level troughs and mid-latitude cyclones. What relationships do you see in real-time forecast models?
Use a map of 500 mb vorticity from the most recent NAM forecast model to practice analyzing areas of cyclonic vorticity advection (CVA) as well as anticyclonic vorticity advection (AVA). Do you seem to find regions of CVA ahead of or in the wake of upper-level troughs?
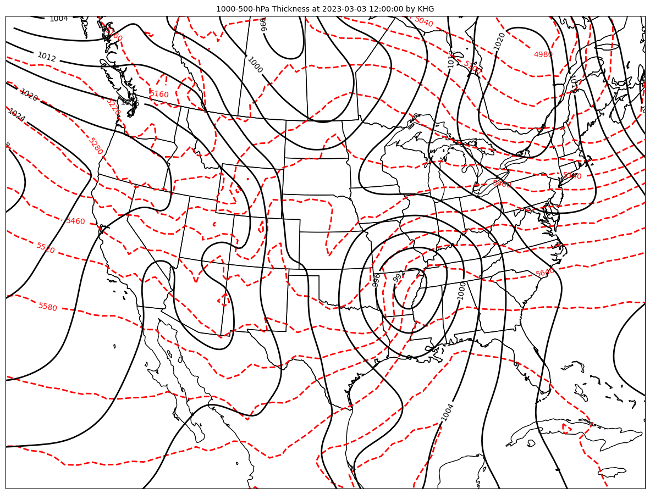
Consider the following image – where is the 1000-500 hPa thickness high (and where is it low). How does this coincide with the surface low across the Plains? Where might you expect to find an upper-level trough (and ridge)?