19.4. Scaling Variables#
This notebook demonstrates the use of the scale parameter to plot the Absolute Vorticity.
Import Packages#
from datetime import datetime, timedelta

import metpy.calc as mpcalc
from metpy.plots import declarative
from metpy.units import units
import numpy as np
import xarray as xr
Get Data#
# Set the date/time of the model run
date = datetime(2017, 2, 24, 12)

# Remote access to the dataset from the NCEI Archive
ds = xr.open_dataset('https://www.ncei.noaa.gov/thredds/dodsC/model-gfs-g3-anl-files-old'
                     f'/{date:%Y%m}/{date:%Y%m%d}/gfsanl_3_{date:%Y%m%d_%H}00_000.grb')

# Subset data to be just over the U.S. for plotting purposes
ds = ds.sel(lat=slice(70,10), lon=slice(360-140, 360-60))
Scaling Data#
Since vorticity values are on the order of \(10^{-5}\) we want to scale them to fit common contouring values of whole numbers, so we want to set the scale attribute to be 1e5.
# Set the plot time with forecast hours
plot_time = date + timedelta(hours=0)
# Set attributes for plotting contours
cfill = declarative.FilledContourPlot()
cfill.data = ds
cfill.field = 'Absolute_vorticity_isobaric'
cfill.level = 500 * units.hPa
cfill.time = date
cfill.contours = list(range(-46, 47, 2))
cfill.colormap = 'PuOr_r'
cfill.colorbar = 'horizontal'
cfill.scale = 1e5
cfill.smooth_field = 3
cntr2 = declarative.ContourPlot()
cntr2.data = ds
cntr2.field = 'Geopotential_height_isobaric'
cntr2.level = 500 * units.hPa
cntr2.time = date
cntr2.contours = list(range(0, 10000, 60))
cntr2.linecolor = 'black'
cntr2.linestyle = 'solid'
cntr2.clabels = True
cntr2.smooth_field = 3
# Set the attributes for the map
# and put the contours on the map
panel = declarative.MapPanel()
panel.area = [-125, -74, 22, 52]
panel.projection = 'lcc'
panel.layers = ['states', 'coastline', 'borders']
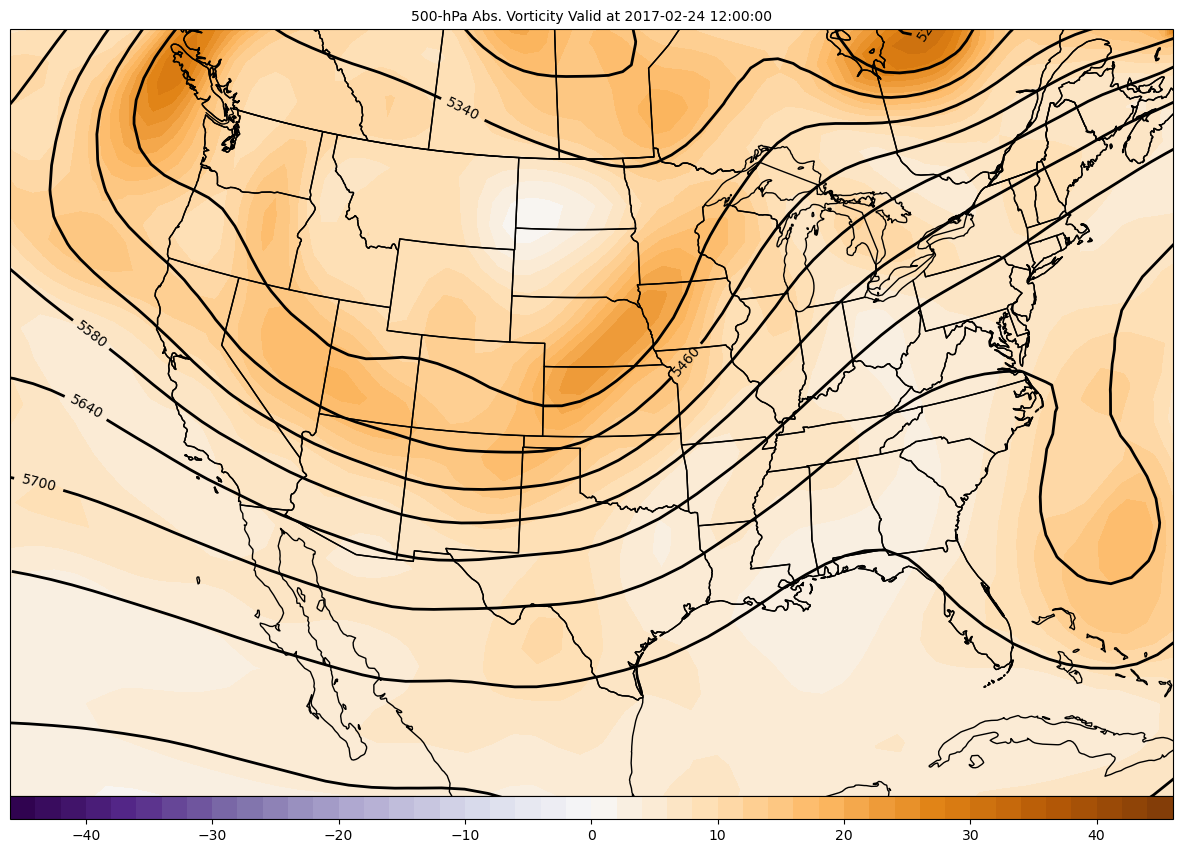
panel.title = f'{cfill.level.m}-hPa Abs. Vorticity Valid at {date}'
panel.plots = [cfill, cntr2]
# Set the attributes for the panel
# and put the panel in the figure
pc = declarative.PanelContainer()
pc.size = (15, 15)
pc.panels = [panel]
# Show the figure
pc.show()