10.11. Practice Tasks - Surface Contouring#
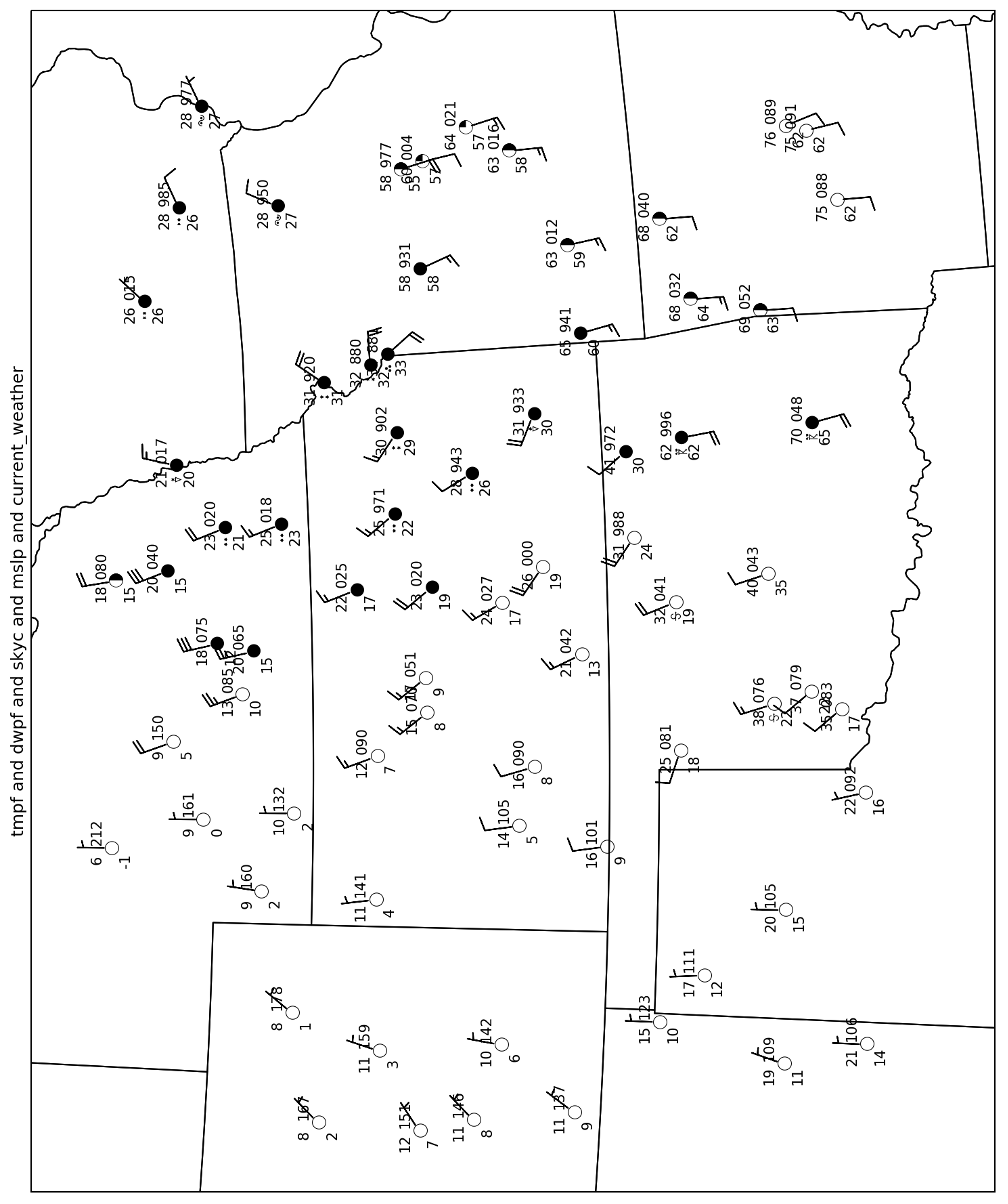
Using the map below, draw mean sea-level pressure contours every 4 mb and temperature contours every 10°F, then analyze the cold and warm front.

Using the map below, draw mean sea-level pressure contours every 4 mb and temperature contours every 10°F, then analyze the cold and warm front.