19.9. Advection Calculation#
This notebook demonstrates computing a temperature advection, then plotting it using color-filled contours.
Import Needed Packages#
from datetime import datetime, timedelta, time, UTC

import metpy.calc as mpcalc
from metpy.plots import declarative
from metpy.units import units
import xarray as xr
Get Data#
# Set the date/time of the model run
yesterday = datetime.now(UTC) - timedelta(days=1)
model_run_time = datetime.combine(yesterday, time(0))

# Remote access to the dataset from the UCAR site
ds = xr.open_dataset('https://thredds.ucar.edu/thredds/dodsC/grib'
                     f'/NCEP/GFS/Global_onedeg/GFS_Global_onedeg_'
                     f'{model_run_time:%Y%m%d}_{model_run_time:%H%M}.grib2')

# Subset data to be just over the U.S. for plotting purposes
ds = ds.sel(lat=slice(70,10), lon=slice(360-150, 360-55))
Calculation#
Pull out necessary variables from dataset.
Do the calculation using MetPy (not too hard).
Add it to the dataarray.
All MetPy Calculations can be found at https://unidata.github.io/MetPy/latest/api/generated/metpy.calc.html
Note
Not all calculations work on grids, yet!
The minus signs are by convention, which means cold air advection will be negative values and warm air advection will be positive values.
Advection Calculation in MetPy
# Select Level and Time
level = 850 * units.hPa
plot_time = model_run_time + timedelta(hours=0)

# Isolate needed variables
tmpk = ds.Temperature_isobaric.metpy.sel(vertical=level, time=plot_time)
uwind = ds['u-component_of_wind_isobaric'].metpy.sel(vertical=level, time=plot_time)
vwind = ds['v-component_of_wind_isobaric'].metpy.sel(vertical=level, time=plot_time)

# Copmute advection and store in Dataset
ds['temperature_advection'] = mpcalc.advection(tmpk, uwind, vwind)
/var/folders/fp/_l45s1m93s5009vb713pyg580000gn/T/ipykernel_81600/3396914952.py:11: UserWarning: Vertical dimension number not found. Defaulting to (..., Z, Y, X) order.
  ds['temperature_advection'] = mpcalc.advection(tmpk, uwind, vwind)
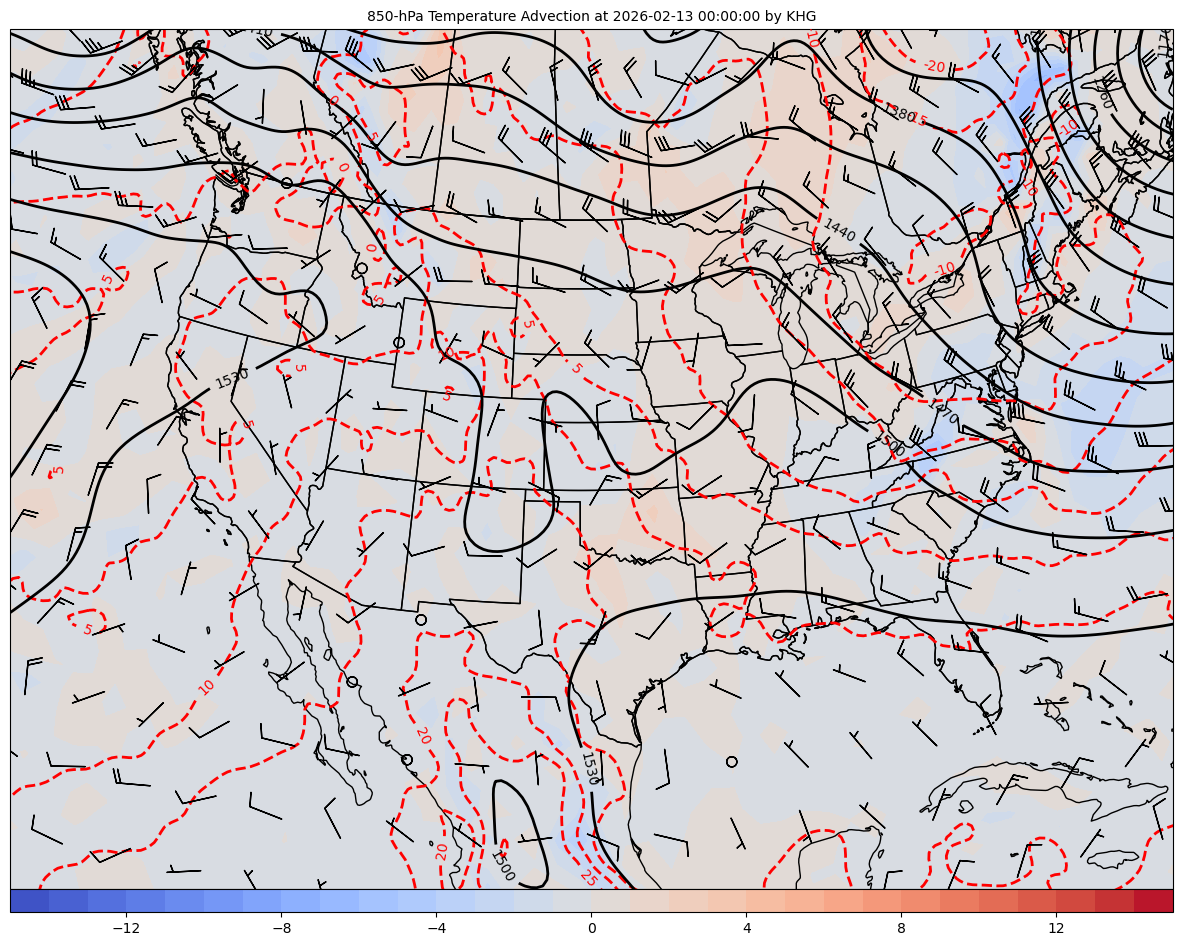
Plot Temperatue Advection#
Here we plot temperature advection and we want to scale our advection to be in Celsius per 3 hours. We need to change two attributes to get there, first plot_units we can set to degC/hour, then we set the scale attribute to 3 to get our value over a three hour period.
We’ll also use the smooth_contour attribute to smooth the Geopotential Heights and Temperature variables.
# Set attributes for plotting contours
cfill = declarative.FilledContourPlot()
cfill.data = ds
cfill.field = 'temperature_advection'
cfill.level = None # Since already chose level
cfill.time = None # Since already chose time
cfill.contours = list(range(-15, 16, 1))
cfill.colormap = 'coolwarm'
cfill.colorbar = 'horizontal'
cfill.scale = 3
cfill.plot_units = 'degC/hour'

cntr = declarative.ContourPlot()
cntr.data = ds
cntr.field = 'Temperature_isobaric'
cntr.level = level
cntr.time = plot_time
cntr.contours = list(range(-40, 41, 5))
cntr.linecolor = 'red'
cntr.linestyle = 'dashed'
cntr.clabels = True
cntr.plot_units = 'degC'
cntr.smooth_contour = 4

cntr2 = declarative.ContourPlot()
cntr2.data = ds
cntr2.field = 'Geopotential_height_isobaric'
cntr2.level = level
cntr2.time = plot_time
cntr2.contours = list(range(0, 10000, 30))
cntr2.linecolor = 'black'
cntr2.linestyle = 'solid'
cntr2.clabels = True
cntr2.smooth_field = 2
cntr2.smooth_contour = 4

barbs = declarative.BarbPlot()
barbs.data = ds
barbs.time = plot_time
barbs.field = ['u-component_of_wind_isobaric', 'v-component_of_wind_isobaric']
barbs.level = level
barbs.skip = (3, 3)
barbs.plot_units = 'knot'

# Set the attributes for the map
# and put the contours on the map
panel = declarative.MapPanel()
panel.area = [-125, -74, 20, 55]
panel.projection = 'lcc'
panel.layers = ['states', 'coastline', 'borders']
panel.title = f'850-hPa Temperature Advection at {plot_time} by KHG'
panel.plots = [cfill, cntr, cntr2, barbs]

# Set the attributes for the panel
# and put the panel in the figure
pc = declarative.PanelContainer()
pc.size = (15, 15)
pc.panels = [panel]

# Show the figure
pc.show()