
12. Gridded Data and Contour Plotting#
So far this semester we have used real data, both surface and upper-air
data, which come from instrumentation deployed throughout the
atmosphere. We now turn to plotting model output using Python, which is
on a defined grid. Previously we created maps using PlotObs(), which
uses observational data that are NOT gridded; it plots data at
observation points, which are not on a standardized grid. Model output,
on the other hand, is gridded with points at regularly spaced intervals
in the horizontal as well as the vertical (Fig. 12.1).
With gridded data (e.g., model output) we can put the computer to work to generate contours that will conform to the data instead of having to do all that work by hand analysis from our point observations. This allows meteorologists to make hundreds of analyzed maps quickly that can then be inspected to determine what is happening now and if there are forecast output, then into the future as well!
Our goal in this chapter is to be able to find, access, and understand what data are contained within gridded files and be able to create contour plots analyzing the data.
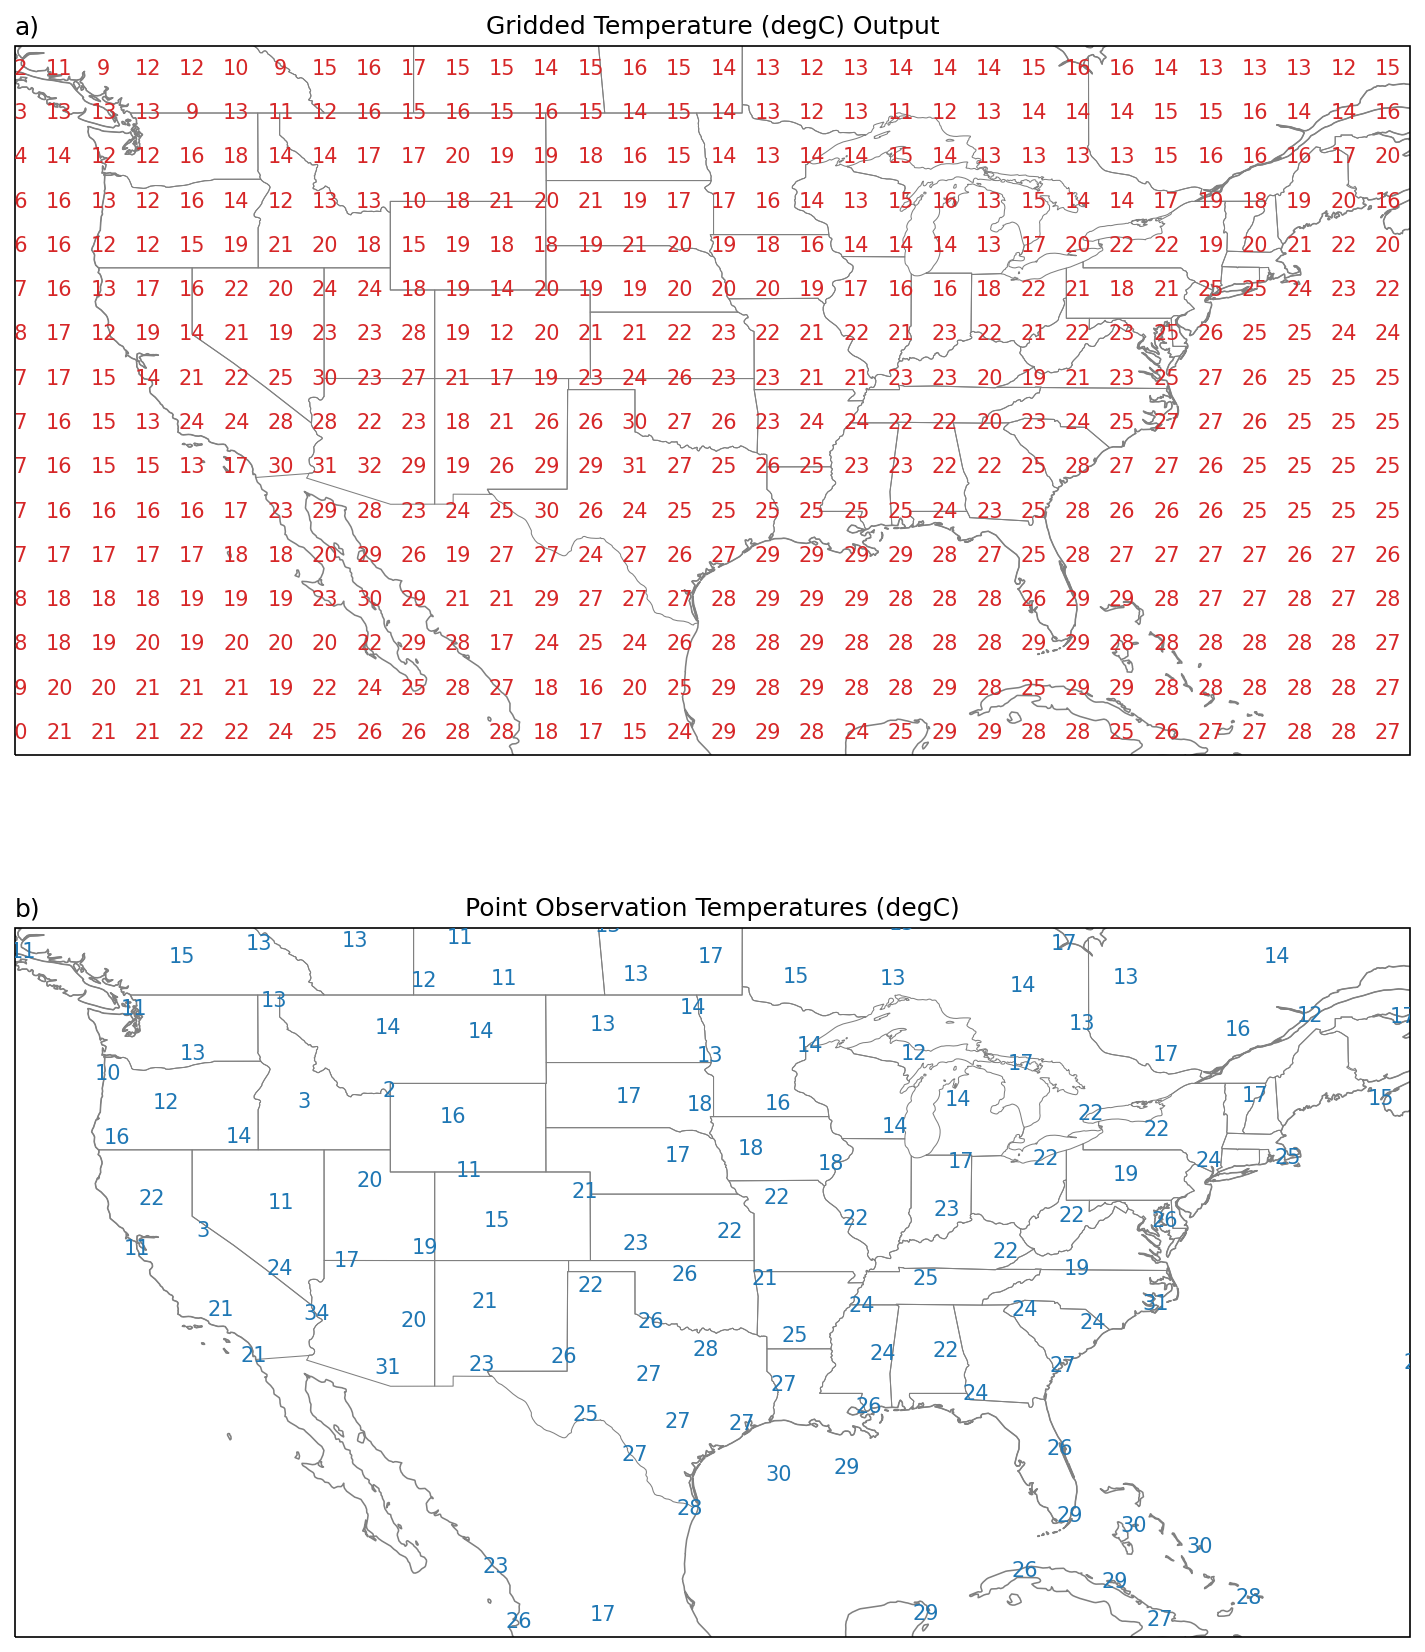
Fig. 12.1 a) gridded data on regularly spaced grids and b) observations from discrete locations from where those particular observations came from.#