
8.6. Station Model Location Details#
The layout of data around a station model is very important. At the
beginning of this section we reviewed the typical layout for the display
of meteorological variables around a surface station. In our plotting of
surface observations (PlotObs) we can set everything in the same way.
The following is the location where a variable will be placed (Fig. 8.3), depending
on the string at each location.
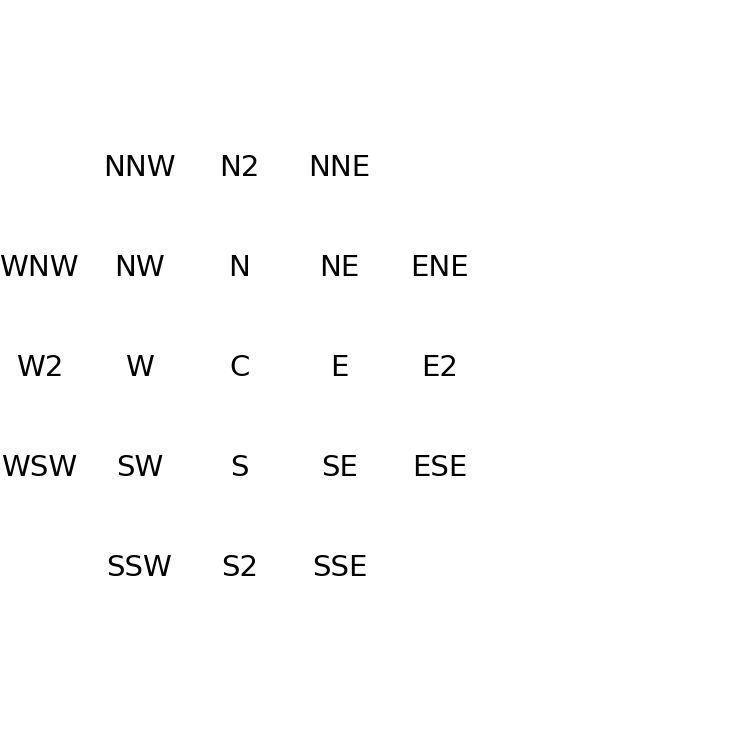
Fig. 8.3 Graphic representation of the different possible locations around a surface
station model using MetPy PlotObs.#
The default location is C.
What variable should be plotted with the location of C (center)?
What about the W (west) location?
What about for a station model that you wanted to plot: temperature, dewpoint, mslp, current weather, and visibility?
Now let’s work to plot a full suite of observation information for multiple stations.