
8.2. Surface Observation Chart#
Making and reading our surface charts are important, as it is essential to read them quickly to diagnose the constantly changing environment. A surface map can tell you a lot of information about the current environment. Observations near big bodies of water will likely have differing characteristics than stations just a little farther inland. Additionally, there will be differences between observations near cities versus out in the middle of cornfields. These variations in meteorological parameters could be very important to the future evolution of the weather at a given location. Therefore, it is important to completely understand how surface maps are created and be able to explain meteorological differences between different regions.
Example Surface Map
Here is an example of a surface map (Fig. 8.2) containing many surface station models (Fig. 8.1) representing surface variables using the MetPy declarative syntax. Notice how we can change the colors of elements of the station model to be able to more easily read the disparate pieces of information.
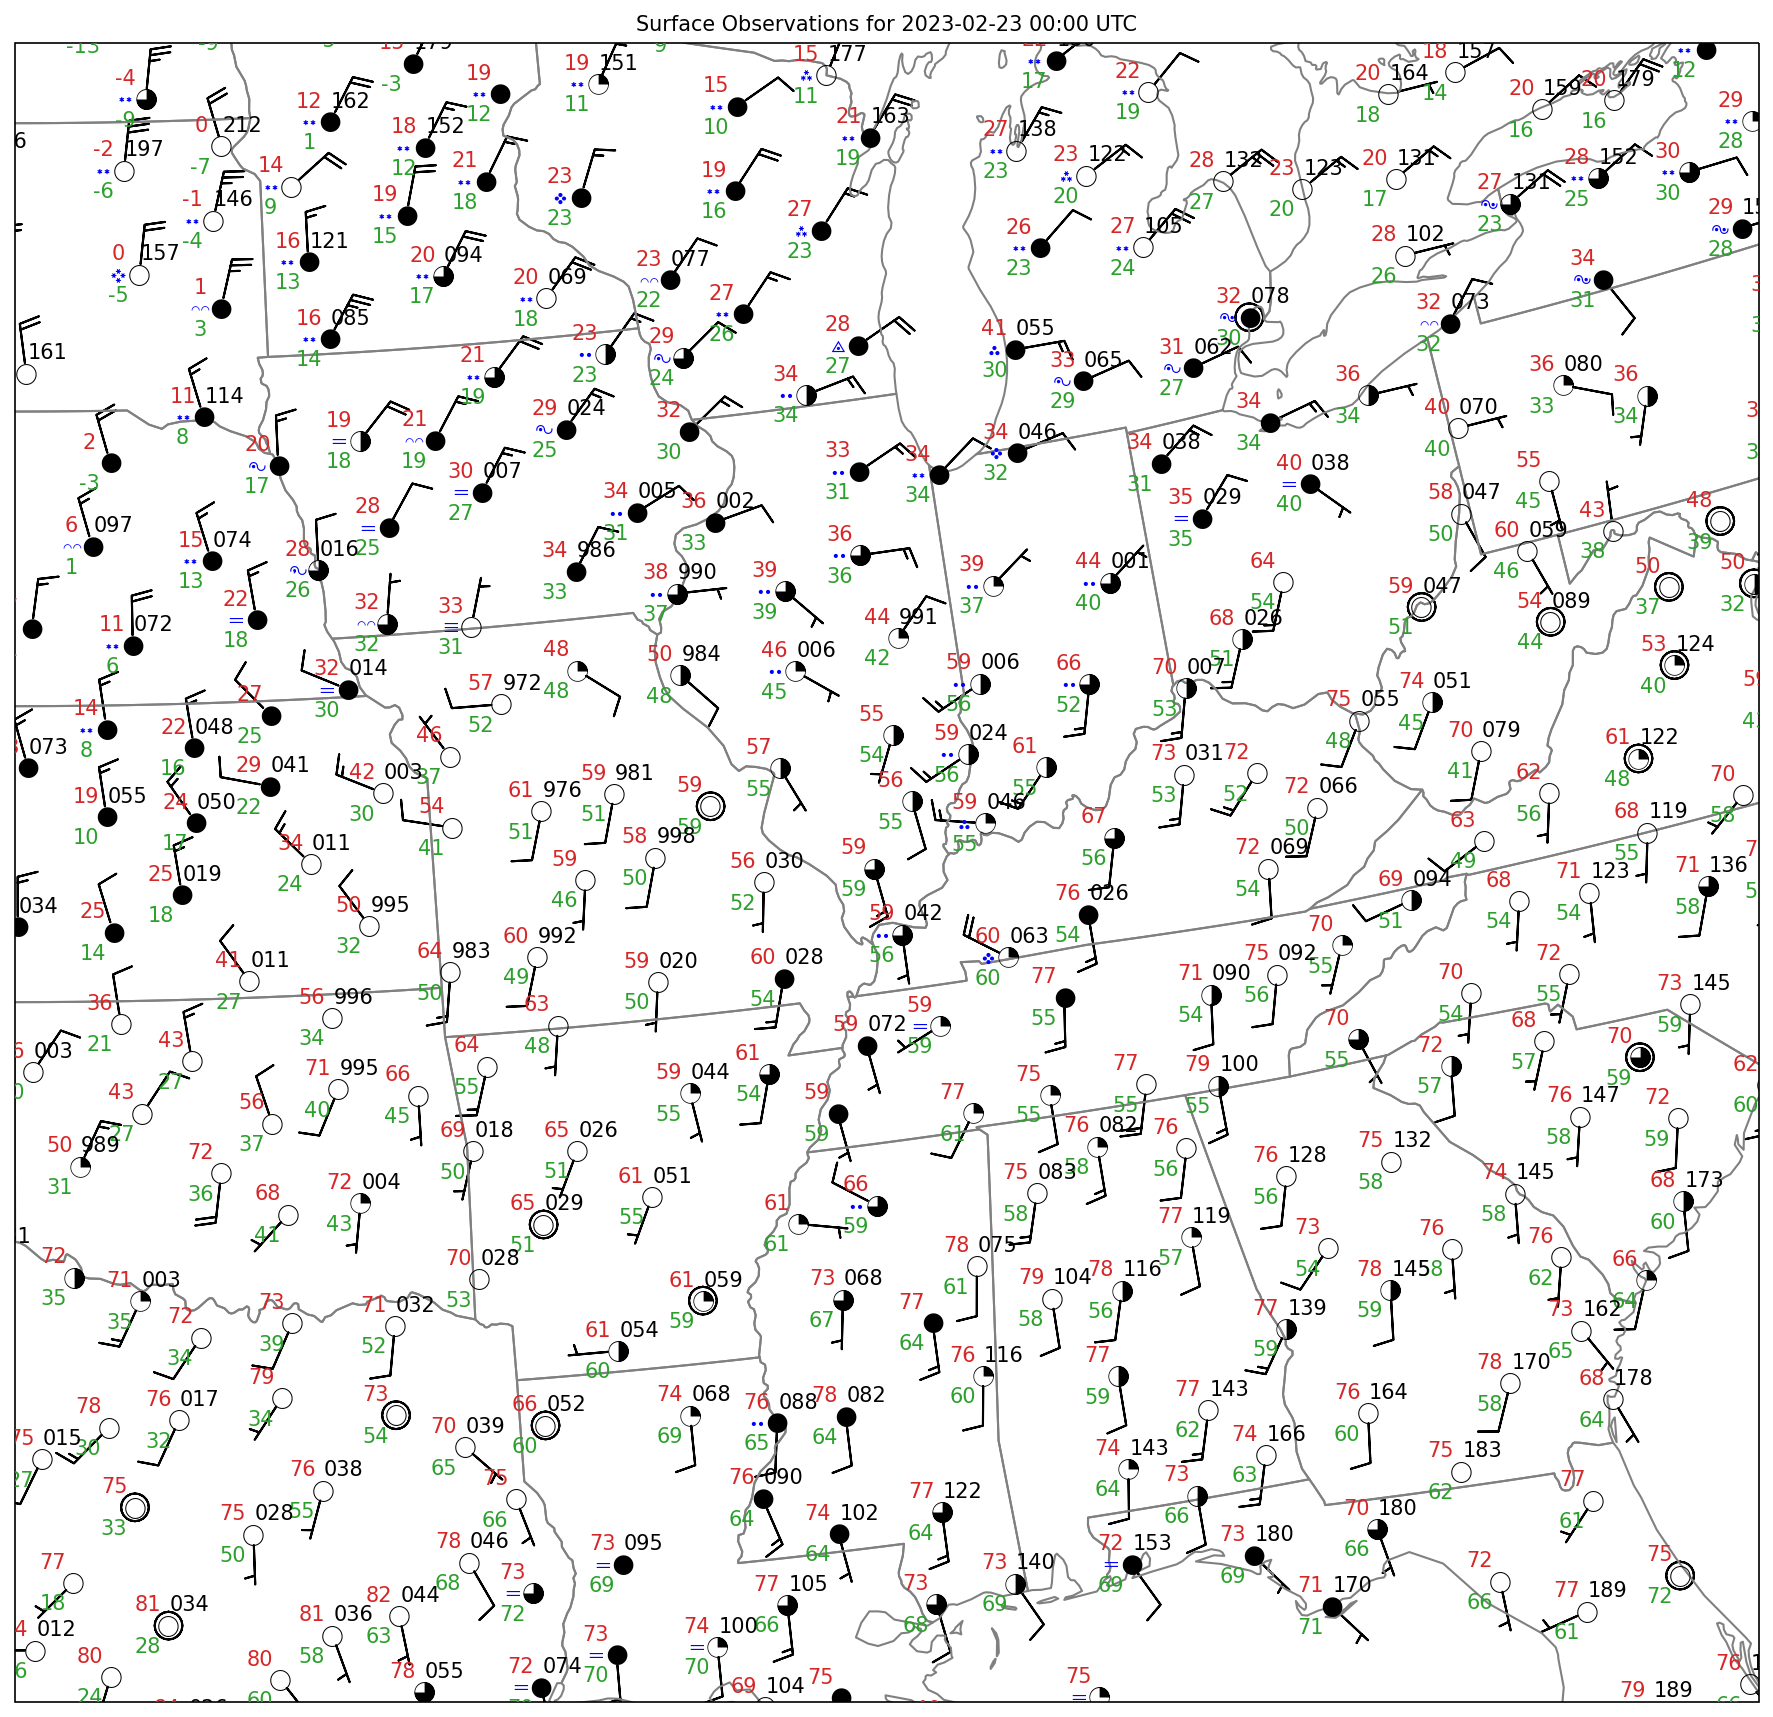
Fig. 8.2 Midwest surface observations at 0000 UTC 23 February 2023.#
Now that we have learned a little bit about surface station models, let’s make our own plots using the MetPy declarative syntax.